 |
||
|
|
||
|
Page Title:
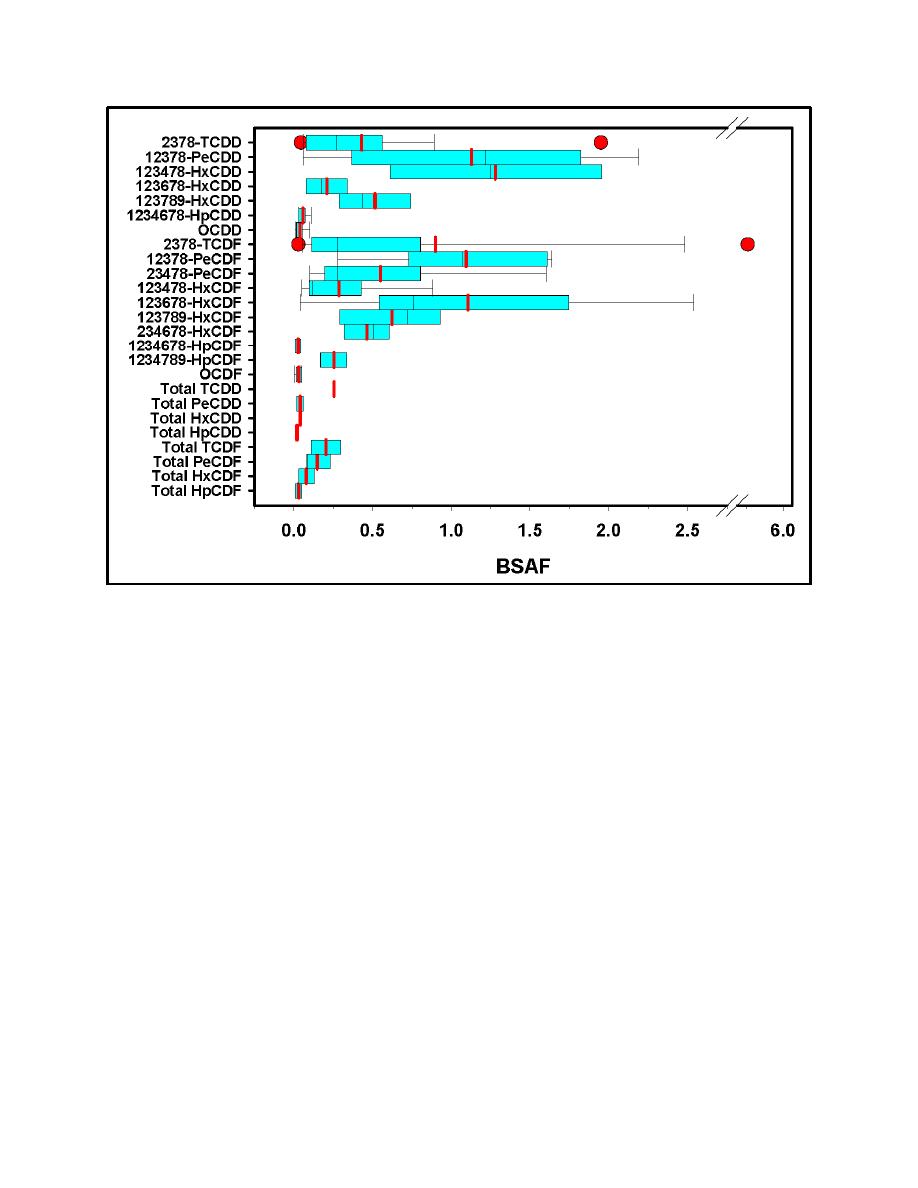
Figure 1. Boxplot of PCDD/F BSAFs calculated from data of studies cited in Table 2. |
||
| |||||||||||||||
|
|
 ERDC TN-DOER-R5
September 2004
Figure 1.
Boxplot of PCDD/F BSAFs calculated from data of studies cited in Table 2. Boxes are
medians, 25th and 75th percentiles. Whiskers are 10th and 90th percentiles. Balls are 5th
and 95th percentiles. Red (bolded) vertical lines are means
UNCERTAINTY ANALYSES: Estimates of uncertainty for TBP were determined using RSS
and bootstrap methods. The latter was also used to conduct nonparametric tests of significance
comparing TBP with measured mean tissue concentrations Ct. Calculations were performed
using individual mean BSAFs for each PCDD/F congener or homologue, and also an overall
mean BSAF for all PCDD/Fs.
Root Sum of Squares (RSS) Uncertainty. The first step in estimating the bioaccumulation
potential of a chemical in a sediment and the uncertainty surrounding the estimate is to calculate
TBP using Equation 1 with a BSAF for the chemical, relevant sediment concentration, organic
carbon content, and lipid content of a target organism, as in the data of Tables 3 and 4. For
example, substituting the data for 2,3,7,8-TCDD:
2,3,7,8-TCDD TBP = 0.433 * (0.474/0.0050365) * 0.0331176 = 1.350
(6)
6
|
|
Privacy Statement - Press Release - Copyright Information. - Contact Us - Support Integrated Publishing |
