 |
||
|
|
||
|
Page Title:
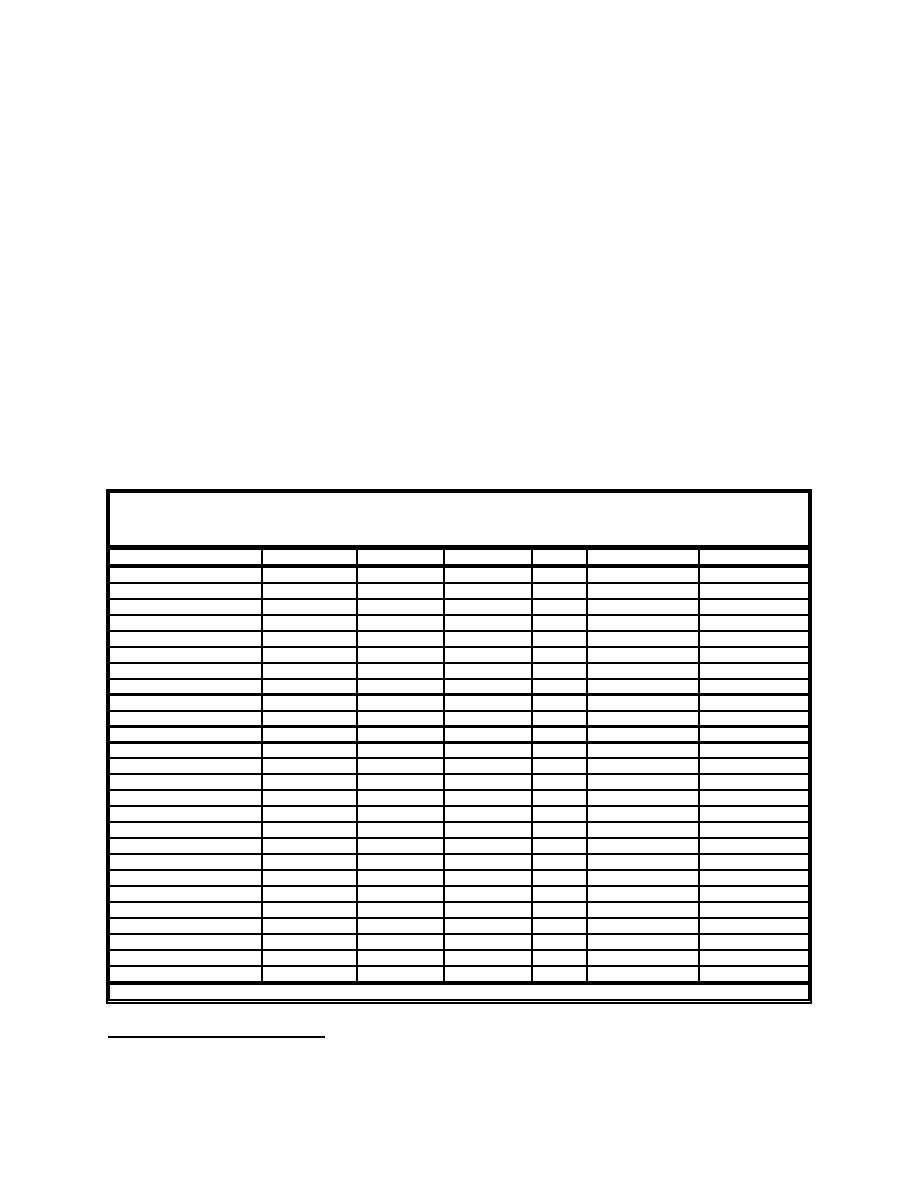
Table 3. Dioxin and Dibenzofuran BSAFs and Summary Statistics for Benthically Coupled Biota Using Studies Cited in Table 2 |
||
| |||||||||||||||
|
|
 ERDC TN-DOER-R5
September 2004
Mean BSAFs for each of the seventeen 2,3,7,8-Cl-substituted PCDD/F congeners and for
homologue groups are reported with relevant statistics in Table 3. The BSAF distributions were
skewed for many of the congeners and homologue groups (Figure 1). Total error for each of the
mean BSAFs was estimated as follows:
1. Calculate mean square error (MSE) as an estimate of the "within treatment" variance
based on individual sample variances si2 , where
MSE = Σ [ si2 ( ni 1) ] / Σ ( ni 1)
(2)
2. Calculate overall variance for each congener or homologue group as an estimate of the
"between treatment" variance, using all of the BSAFs for each chemical.
3. Overall N = Σ ni for each chemical1
(3)
4. Total Error = [ ( MSE + Overall Variance ) / Overall N ]
(4)
The total error for each mean BSAF was then used as a standard error to derive 95-percent
confidence intervals (Table 3):
CI = mean BSAF t0.95,overall N-1*total error
(5)
Table 3
Dioxin and Dibenzofuran BSAFs and Summary Statistics for Benthically Coupled Biota Using
Studies Cited in Table 2
1
PCDD/F
Mean BSAF
Overall N
Total Error
t
Lower 95% CL
Upper 95% CL
2,3,7,8-TCDD
0.433
85.5
0.297
1.663
-0.061
0.927
1,2,3,7,8-PeCDD
1.128
91.5
0.272
1.662
0.675
1.581
1,2,3,4,7,8-HxCDD
1.283
8.5
0.328
1.876
0.668
1.898
1,2,3,6,7,8-HxCDD
0.211
9.5
0.063
1.845
0.095
0.326
1,2,3,7,8,9-HxCDD
0.514
111.5
0.063
1.659
0.410
0.619
1,2,3,4,6,7,8-HpCDD
0.050
11.5
0.019
1.804
0.016
0.084
OCDD
0.039
10.5
0.021
1.822
0.002
0.077
2,3,7,8-TCDF
0.899
257.5
0.475
1.651
0.115
1.683
1,2,3,7,8-PeCDF
1.093
66.5
0.352
1.668
0.507
1.680
2,3,4,7,8-PeCDF
0.550
68.5
0.259
1.668
0.118
0.982
1,2,3,4,7,8-HxCDF
0.288
39.5
0.285
1.685
-0.192
0.768
1,2,3,6,7,8-HxCDF
1.105
114.5
0.159
1.658
0.842
1.367
1,2,3,7,8,9-HxCDF
0.623
8.5
0.157
1.876
0.328
0.917
2,3,4,6,7,8-HxCDF
0.463
9.5
0.086
1.845
0.304
0.622
1,2,3,4,6,7,8-HpCDF
0.032
9.5
0.009
1.845
0.015
0.048
1,2,3,4,7,8,9-HpCDF
0.252
8.5
0.043
1.876
0.171
0.333
OCDF
0.033
10.5
0.008
1.822
0.019
0.047
Total TCDD
0.255
2
0.005
6.314
0.223
0.287
Total PeCDD
0.039
2
0.019
6.314
-0.081
0.159
Total HxCDD
0.038
2
0.013
6.314
-0.041
0.116
Total HpCDD
0.019
2
0.011
6.314
-0.051
0.089
Total TCDF
0.187
7
0.058
1.943
0.074
0.299
Total PeCDF
0.151
5
0.064
2.132
0.014
0.289
Total HxCDF
0.079
2
0.051
6.314
-0.243
0.401
Total HpCDF
0.029
2
0.021
6.314
-0.102
0.160
ALL
0.573
945.5
0.139
1.646
0.344
0.802
1
Overall N was estimated as the mean of differing sample sizes for the four BSAF input parameters (Cs, TOC, Ct, lipid)
1
When n was not given for an individual BSAF, a default minimum sample size was used: n = 2 if a standard error
was given, or n = 1 if no standard error was given. This results in conservative confidence intervals.
5
|
|
Privacy Statement - Press Release - Copyright Information. - Contact Us - Support Integrated Publishing |
