 |
||
|
|
||
|
Page Title:
Table 5. Method Error, Propagated Error, RSS Total Error, TBP Total Error Limits, Error Ratio, and Comparison with Measured, ... |
||
| |||||||||||||||
|
|
 ERDC TN-DOER-R5
September 2004
concentration was 1.774 pg g-1 (Table 4). In this case TBP underestimated the measured tissue
concentration by about 24 percent (relative percent difference, Table 4), and Ct was well within
the RSS range of uncertainty (Table 5).
Above formulae and additional explanation are given in McFarland and Clarke (1999) and
Clarke and McFarland (2000).
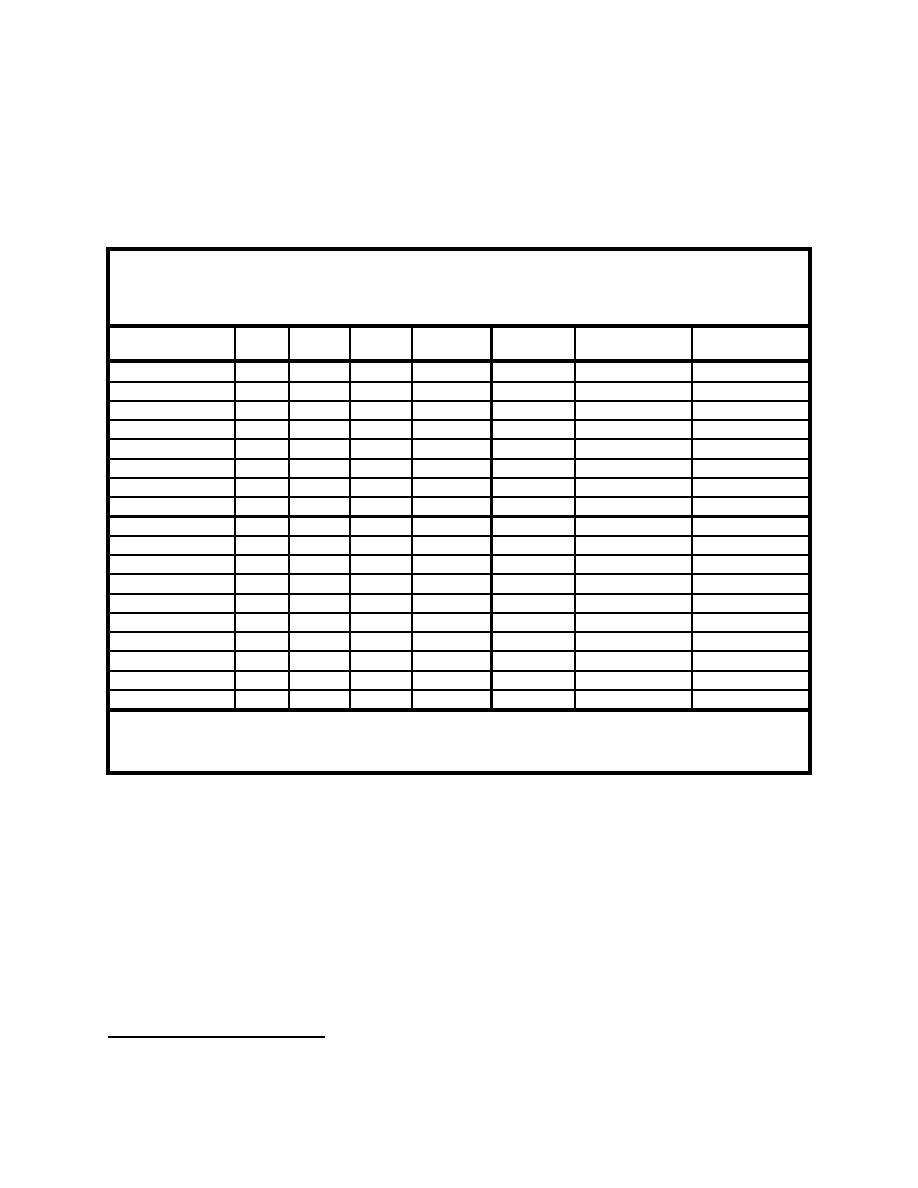
Table 5
Method Error, Propagated Error, RSS Total Error, TBP Total Error Limits, Error Ratio, and
Comparison with Measured, Pooled Tissue Concentrations of Dioxins and Furans at the New
York Bight Apex Benthic Sampling Location
4
TE Interval Width
Ct within TE
1
2
3
PCDD/F
ME
PE
TE
TBP - TE
TBP + TE
TBP
Interval?
2,3,7,8-TCDD
0.847
2.920
3.040
-1.690
4.390
4.5
Within
1,2,3,6,7,8-HxCDD
0.519
1.572
1.656
-0.827
2.484
4.0
Within
1,2,3,7,8,9-HxCDD
1.290
3.837
4.048
-1.991
6.105
3.9
Within
1,2,3,4,6,7,8-HpCDD
0.902
3.059
3.189
-1.751
4.627
4.4
Within
OCDD
7.503
26.635
27.671
-15.707
39.636
4.6
Within
2,3,7,8-TCDF
2.660
9.102
9.483
-5.242
13.724
4.5
Within
1,2,3,4,7,8-HxCDF
0.543
2.237
2.302
-1.436
3.167
5.3
Within
1,2,3,6,7,8-HxCDF
0.922
2.704
2.857
-1.386
4.327
3.9
Within
1,2,3,7,8,9-HxCDF
0.841
2.512
2.649
-1.308
3.990
4.0
Within
1,2,3,4,6,7,8-HpCDF
0.216
0.692
0.725
-0.381
1.069
4.2
Above
OCDF
0.411
1.323
1.385
-0.729
2.041
4.2
Within
Total TCDD
0.547
1.588
1.680
-0.807
2.553
3.8
Above
Total HxCDD
0.399
1.861
1.904
-1.268
2.540
6.0
Above
Total HpCDD
0.524
3.527
3.565
-2.729
4.401
8.5
Above
Total TCDF
2.008
6.989
7.272
-4.070
10.474
4.5
Above
Total PeCDF
0.874
3.335
3.448
-2.054
4.841
4.9
Within
Total HxCDF
0.630
4.548
4.591
-3.587
5.596
9.1
Within
Total HpCDF
0.282
2.194
2.212
-1.762
2.662
9.8
Above
1
Method Error (avg ME = 62.7 percent).
Avg = 5.2
2
Propagated error.
3
Total error.
4
Ct from Table 4.
Bootstrap Uncertainty. Bootstrap estimates of TBP means and standard errors were derived
using SAS procedures and programming language to generate 1,000 bootstrap resamples1 of
each TBP input parameter. Means of the resamples were inserted in Equation 1 to generate 1,000
bootstrap estimates of TBP for each PCDD/F congener or homologue group. The mean and
standard deviation of this distribution were, respectively, the bootstrap mean TBP and bootstrap
standard error of the mean. Lower and upper 95 percent confidence limits for the bootstrap mean
TBP were defined, respectively, as the 2.5th percentile and 97.5th percentile of the bootstrap
TBP distribution (Table 6). Bootstrap bias was defined as the difference between the bootstrap
mean TBP and the calculated TBP, expressed as percent of the calculated TBP.
1
Computer resources are generally no longer a limiting factor for the number of bootstrap resamples. At least 1,000
resamples are recommended.
9
|
|
Privacy Statement - Press Release - Copyright Information. - Contact Us - Support Integrated Publishing |