 |
||
|
|
||
|
Page Title:
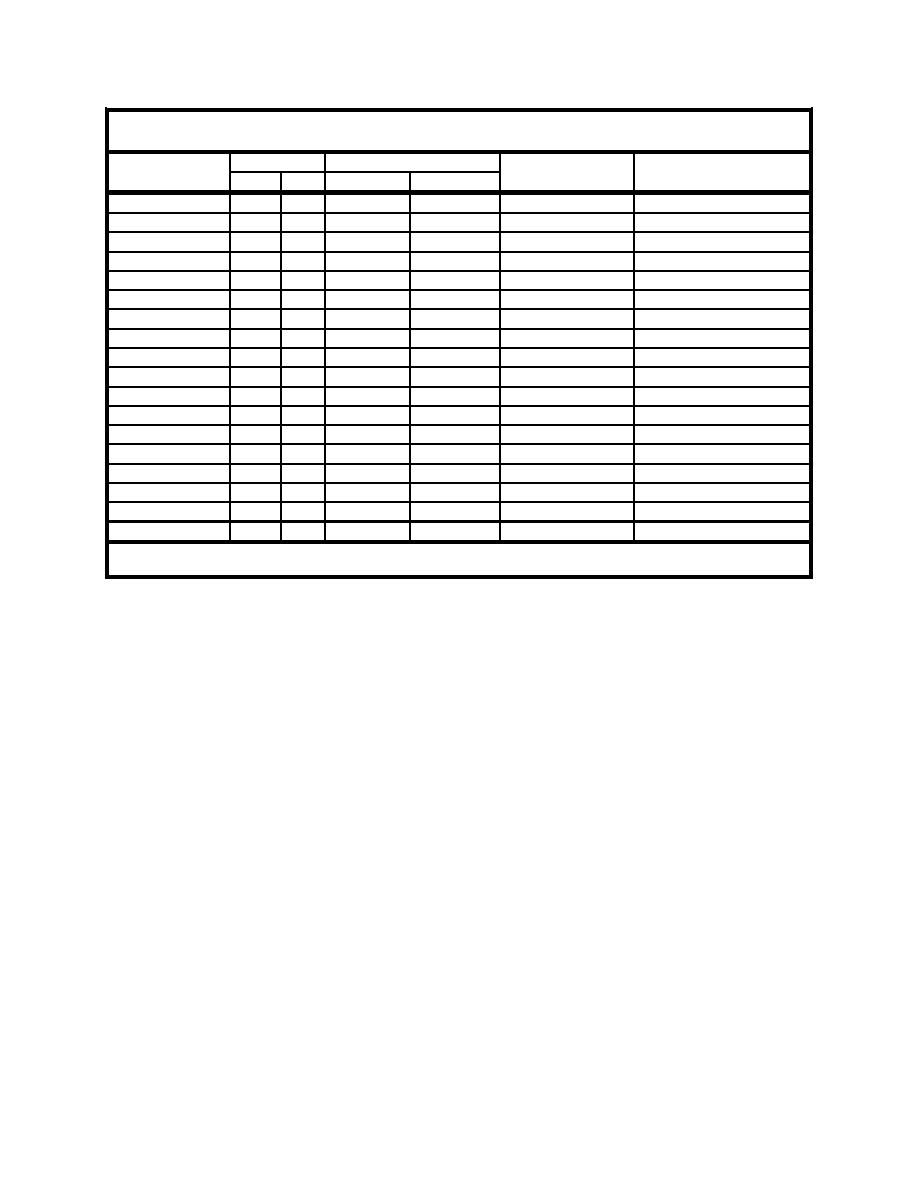
Table 6. Bootstrap Uncertainty Analysis Using Congener- and Homologue-Specific BSAFs of Table 2 |
||
| |||||||||||||||
|
|
 ERDC TN-DOER-R5
September 2004
Table 6
Bootstrap Uncertainty Analysis Using Congener- and Homologue-Specific BSAFs of Table 2
Bootstrap TBP Bootstrap Confidence Limits Bootstrap
Ct Within Bootstrap
PCDD/F
Uncertainty Ratio
Confidence Limits?
1
2
Upper (97.5)
Mean
Se
Lower (2.5)
2,3,7,8-TCDD
1.462
0.747
0.575
3.339
1.89
Within
1,2,3,6,7,8-HxCDD
0.897
0.462
0.235
2.059
2.03
Within
1,2,3,7,8,9-HxCDD
2.238
1.055
0.814
4.870
1.81
Within
1,2,3,4,6,7,8-HpCDD 1.563
0.905
0.419
3.918
2.24
Within
OCDD
12.939
7.895
2.824
33.967
2.41
Within
2,3,7,8-TCDF
4.641
2.490
1.447
10.885
2.03
Within
1,2,3,4,7,8-HxCDF
0.938
0.649
0.179
2.693
2.68
Within
1,2,3,6,7,8-HxCDF
1.604
0.820
0.513
3.604
1.93
Within
1,2,3,7,8,9-HxCDF
1.458
0.725
0.350
3.312
2.03
Within
1,2,3,4,6,7,8-HpCDF
0.373
0.207
0.094
0.865
2.07
Above
OCDF
0.709
0.366
0.219
1.628
1.99
Above
Total TCDD
0.942
0.328
0.485
1.720
1.31
Above
Total HxCDD
0.690
0.384
0.191
1.626
2.08
Above
Total HpCDD
0.904
0.626
0.164
2.384
2.46
Above
Total TCDF
3.451
2.114
0.701
8.504
2.26
Above
Total PeCDF
1.510
1.067
0.274
4.310
2.67
Above
Total HxCDF
1.083
0.744
0.191
2.866
2.47
Within
Total HpCDF
0.482
0.320
0.078
1.275
2.48
Above
1
Lower distribution percentile.
2
Upper distribution percentile.
Bootstrap tests of significance comparing TBP with observed Ct were conducted for each
PCDD/F congener or homologue group as follows:
1.
The mean Ct was subtracted from the calculated TBP to obtain a difference D.
2.
The Ct data were randomly resampled 16,000 times to generate 16,000 bootstrap mean
Ct estimates.
3.
BSAF, Cs, TOC and lipid data were randomly resampled 16,000 times to generate
16,000 bootstrap mean TBP estimates.
4.
Bootstrap Ct and TBP estimates from Steps 2 and 3 were combined into a single data set,
randomly allocated to 16,000 pairs, and the second member of each pair subtracted from
the first to obtain a distribution of 16,000 bootstrap D estimates.
5.
The original D from Step 1 was added to the distribution of bootstrap D and the entire
distribution ordered to obtain the rank of the original D. TBP was considered to
significantly underestimate Ct if the rank of D was less than 400, or to significantly
overestimate Ct if the rank of D was greater than 15,600 (two-tailed significance level of
P < 0.025 in each tail of the distribution or overall P < 0.05) (Table 7).
10
|
|
Privacy Statement - Press Release - Copyright Information. - Contact Us - Support Integrated Publishing |
