 |
||
|
|
||
|
Page Title:
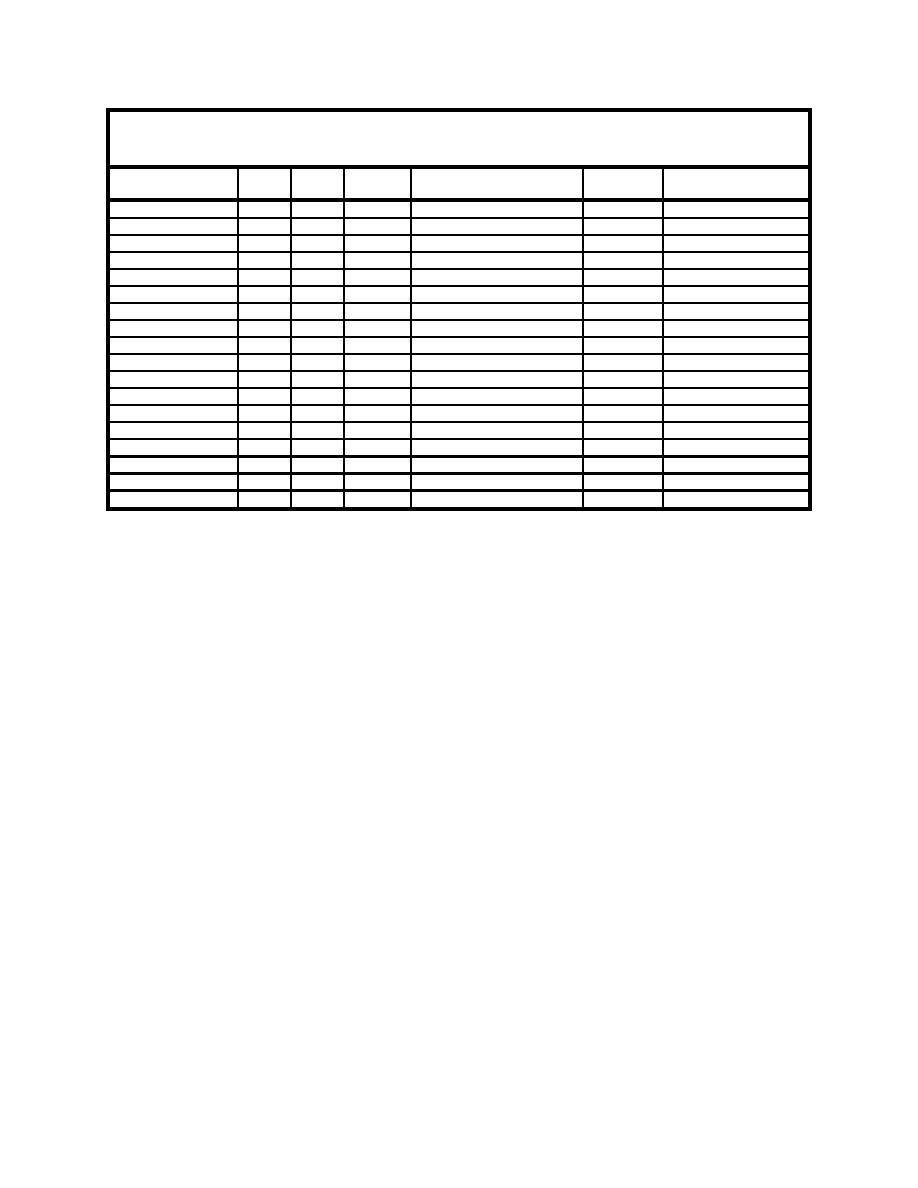
Table 7. Bootstrap Test of Significance for the Difference Between Mean TBP and Mean Measured Concentrations of PCDD/Fs in Po... |
||
| |||||||||||||||
|
|
 ERDC TN-DOER-R5
September 2004
Table 7
Bootstrap Test of Significance for the Difference Between Mean TBP and Mean Measured
Concentrations of PCDD/Fs in Pooled Benthic Organisms of the New York Bight Apex
D = Ct -
Rank of D in Bootstrap
TBP Over- or Under-
PCDD/F
TBP
Ct
TBP
Distribution (N = 16,000)
Bootstrap P
Estimates Mean Ct?
2,3,7,8-TCDD
1.350
1.774
-0.424
2746
0.3433
no
1,2,3,6,7,8-HxCDD
0.828
1.051
-0.222
3649
0.4561
no
1,2,3,7,8,9-HxCDD
2.057
1.047
1.010
14265
0.2169
no
1,2,3,4,6,7,8-HpCDD
1.438
3.323
-1.885
501
0.0626
no
OCDD
11.964
25.639
-13.675
794
0.0993
no
2,3,7,8-TCDF
4.241
3.163
1.078
13273
0.3409
no
1,2,3,4,7,8-HxCDF
0.866
0.796
0.070
9956
0.7555
no
1,2,3,6,7,8-HxCDF
1.471
0.666
0.805
14243
0.2196
no
1,2,3,7,8,9-HxCDF
1.341
0.786
0.555
13737
0.2829
no
1,2,3,4,6,7,8-HpCDF
0.344
4.858
-4.514
54
0.0068
under
OCDF
0.656
1.741
-1.085
204
0.0255
under
Total TCDD
0.873
3.477
-2.604
1
0.0001
under
Total HxCDD
0.636
3.617
-2.980
28
0.0035
under
Total HpCDD
0.836
12.004
-11.168
19
0.0024
under
Total TCDF
3.202
15.924
-12.721
6
0.0008
under
Total PeCDF
1.394
4.789
-3.395
189
0.0236
under
Total HxCDF
1.005
2.598
-1.594
489
0.0611
no
Total HpCDF
0.450
4.137
-3.687
85
0.0106
under
Sensitivity Analysis. Sensitivity analysis was conducted for each TBP input parameter by
calculating a minimum and maximum TBP using the minimum and maximum observed values
of that parameter and the means of the other input parameters. A sensitivity index was computed
as
Abs [ ( max TBP min TBP ) / mean TBP ]
(14)
for each parameter averaged over all PCDD/F congener and homologue groups. Larger values of
the index indicated greater contribution of the associated parameter to the uncertainty in TBP.
DISCUSSION:
RSS Uncertainty. TBP was initially calculated for each PCDD/F congener and homologue
group using the corresponding congener/homologue mean BSAF from Table 3. TBP generally
corresponded well with measured mean tissue concentrations for the PCDD/F congeners, and
less well for the homologue groups (Table 4, Figure 2). RSS uncertainty (TBP " TE) was
determined using average method error (avg ME) of 62.7 percent and Equations 8, 10, 11 and
12; the uncertainty intervals are given in Table 5 and shown graphically in Figure 2. The RSS TE
intervals included mean Ct for 12 PCDD/F congeners and homologue groups, but
underestimated Ct for one congener (1,2,3,4,6,7,8-HpCDF) and five homologue groups (Table 5
and Figure 2). The poorer predictive capability of the homologue-specific BSAFs appears to be
related to the smaller number of observations (in most cases N = 2) as well as probable
disequilibrium between organism and sediment resulting from observations made only on filter-
feeding bivalves.
11
|
|
Privacy Statement - Press Release - Copyright Information. - Contact Us - Support Integrated Publishing |
