 |
||
|
|
||
|
Page Title:
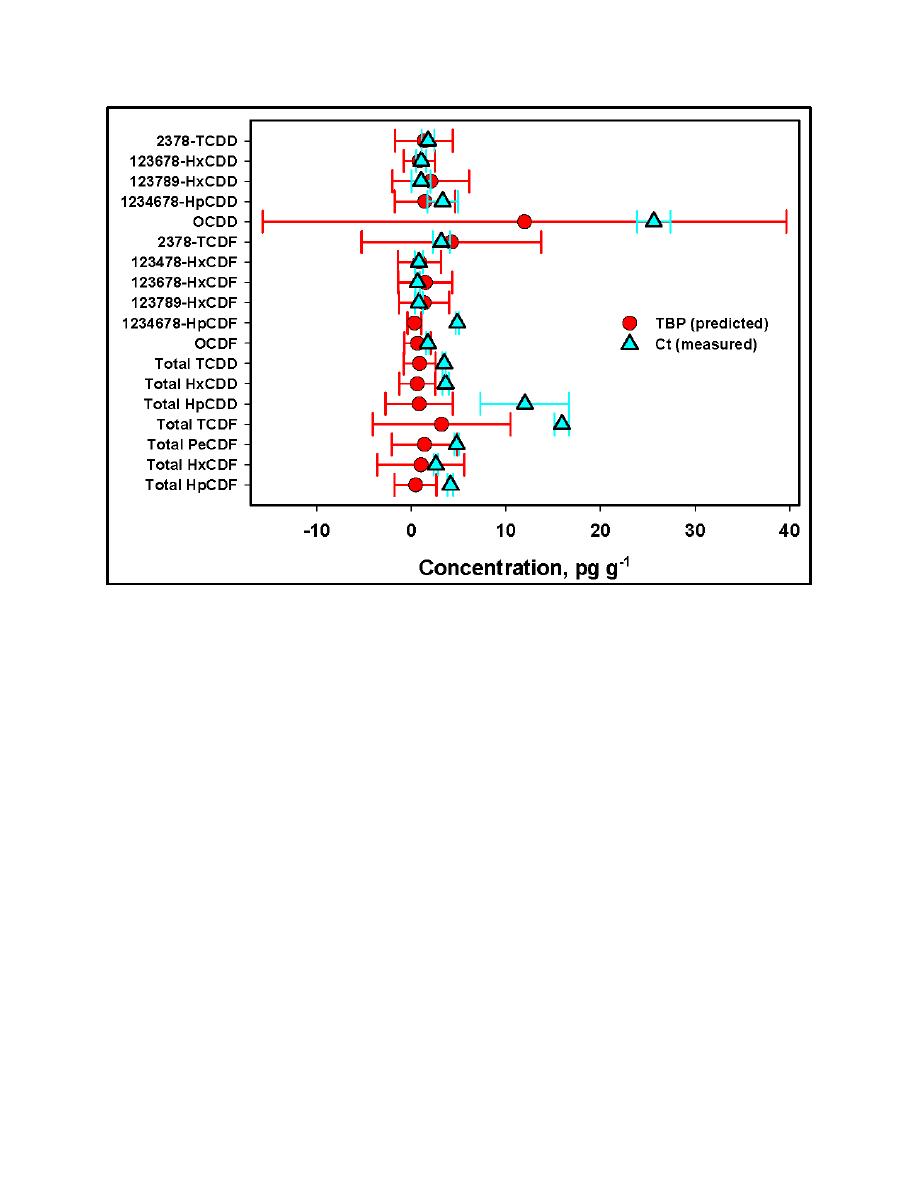
Figure 2. Mean TBP RSS total error estimation of bioaccumulation potential compared with measured PCDD/F concentrations |
||
| |||||||||||||||
|
|
 ERDC TN-DOER-R5
September 2004
Figure 2.
Mean TBP RSS total error estimation of bioaccumulation potential compared with
measured PCDD/F concentrations (Ct 95 percent confidence interval) for pooled benthic
organisms (Table 1) collected in the New York Bight Apex. TBPs calculated with congener-
and homologue-specific BSAFs (Table 3)
RSS calculations were also performed using an overall mean BSAF = 0.573 (Table 3) for all
congeners and homologue groups, to determine whether the overall BSAF could produce
adequate TBP predictions. This resulted in larger average method error (157 percent) as well as
larger propagated error and total error, and thus less precise estimates of TBP. Using the overall
mean BSAF, TBP and its uncertainty interval were generally larger than the corresponding
values calculated using congener/homologue mean BSAFs (Figure 3). The relative percent
difference between TBP and mean Ct ranged from 90 percent to nearly +600 percent (Figure 3),
and the broad RSS TBP uncertainty intervals always included mean Ct. On average, TBP
underestimated Ct by 30 percent when congener-specific BSAFs were used, and overestimated
Ct by 137 percent when the overall mean BSAF was used. Excluding homologue groups, the
average relative disparity between TBP and mean Ct was +2 percent when congener-specific
BSAFs were used, and +179 percent when the overall mean BSAF was used.
12
|
|
Privacy Statement - Press Release - Copyright Information. - Contact Us - Support Integrated Publishing |