 |
||
|
|
||
|
Page Title:
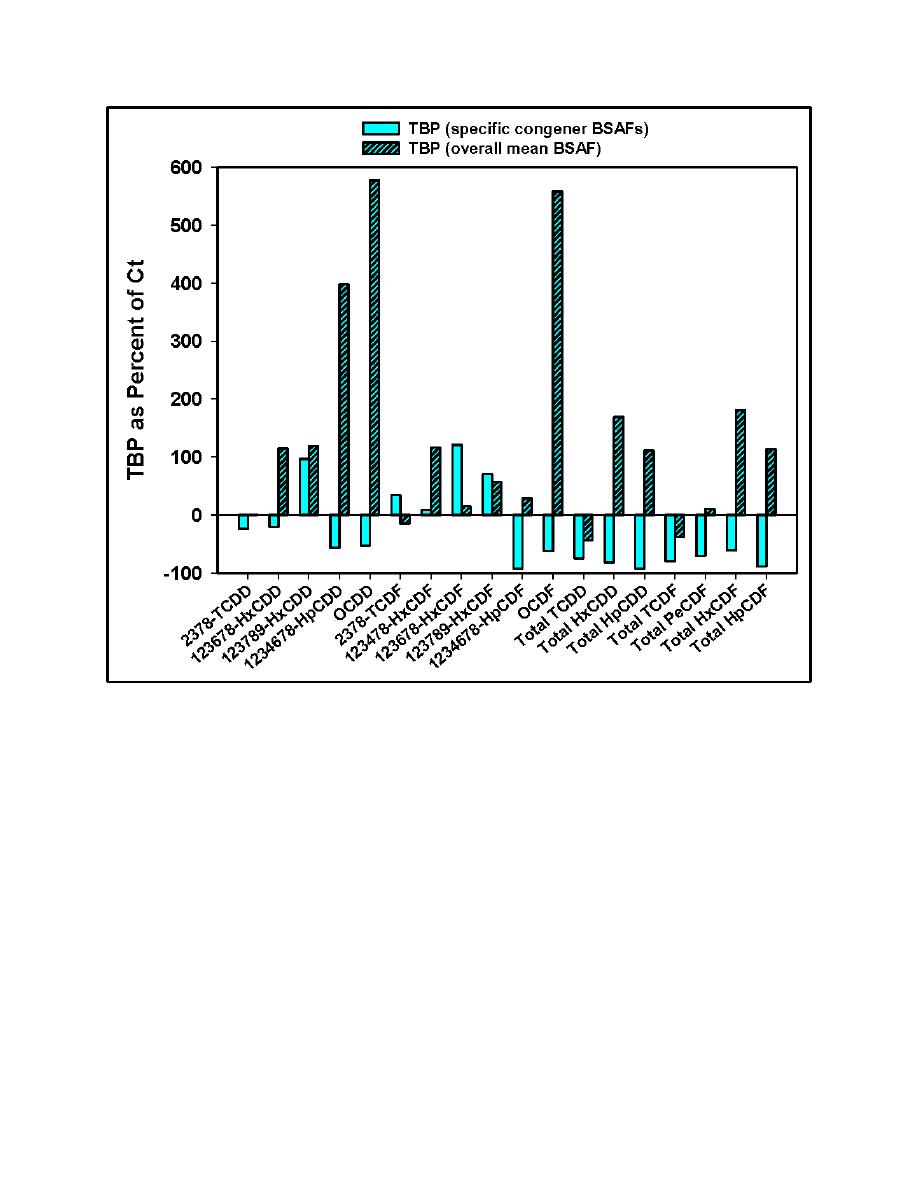
Figure 3. RSS relative percent difference between TBP and Ct using PCDD/F congener- and homologue-specific BSAFs and between ... |
||
| |||||||||||||||
|
|
 ERDC TN-DOER-R5
September 2004
Figure 3.
RSS relative percent difference between TBP and Ct using PCDD/F congener- and
homologue-specific BSAFs and between TBP and Ct calculated using a single overall BSAF
(formula in Table 4)
Bootstrap Uncertainty. Bootstrap calculations of TBP and uncertainty generally mirrored
those of the RSS method, although with narrower uncertainty intervals (Figure 4). The bootstrap
intervals are nonparametric estimates of statistical confidence intervals based solely on
resampling of input parameter replicates. RSS uncertainty intervals, on the other hand, combine a
method error component with incremental (propagated) error derived from parametric
confidence limits for each input parameter, and thus incorporate more sources of uncertainty,
leading to generally broader uncertainty intervals. Bootstrap mean TBPs determined using
congener/homologue mean BSAFs (Table 6) reflected a positive bias of about 8 percent
compared with the calculated TBPs. The positive bias is indicative of a skewed distribution
resulting from simulations involving ratios.
13
|
|
Privacy Statement - Press Release - Copyright Information. - Contact Us - Support Integrated Publishing |
