 |
||
|
|
||
|
Page Title:
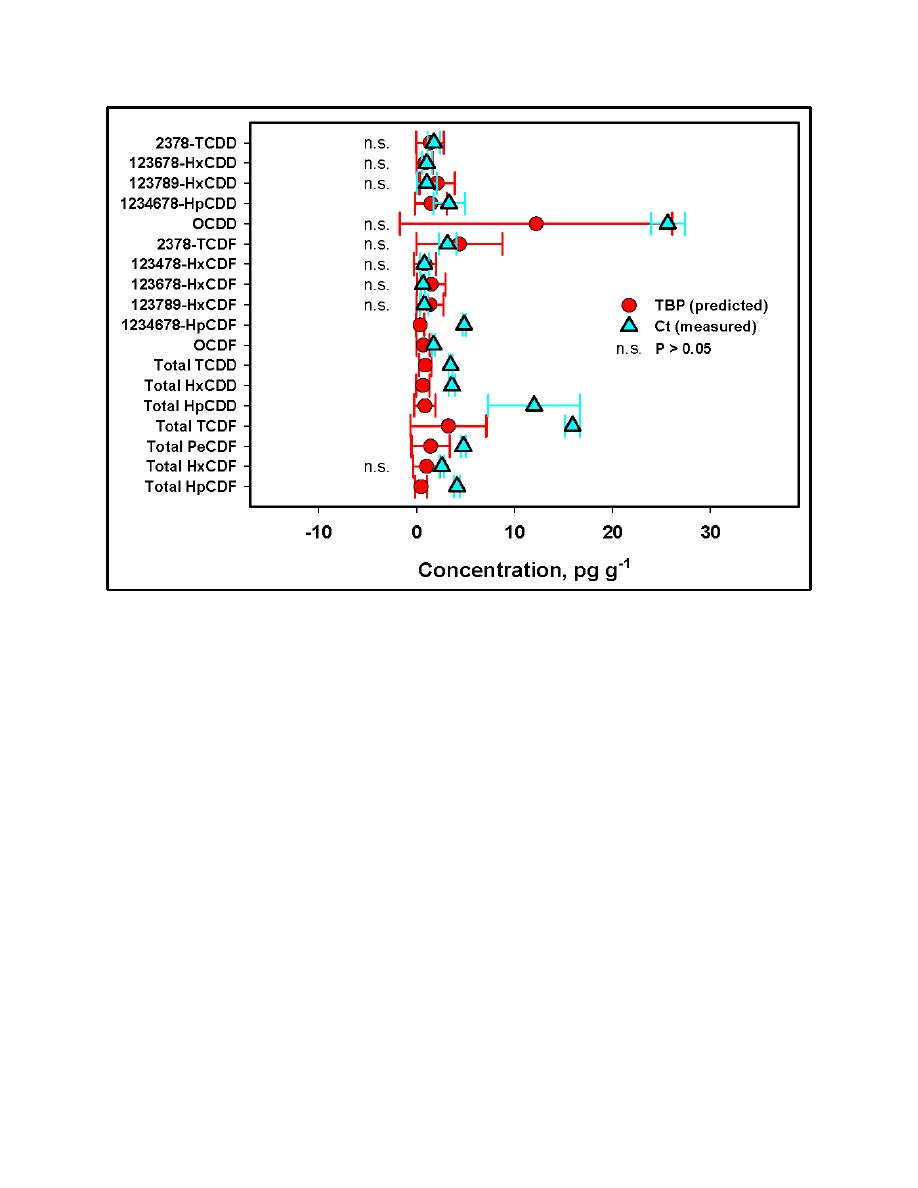
Figure 4. Bootstrap TBP bootstrap 95-percent confidence interval estimation of bioaccumulation potential compared with meas... |
||
| |||||||||||||||
|
|
 ERDC TN-DOER-R5
September 2004
Figure 4.
Bootstrap TBP bootstrap 95-percent confidence interval estimation of bioaccumulation
potential compared with measured PCDD/F concentrations (Ct 95 percent confidence
interval) for pooled benthic organisms (Table 1) collected in the New York Bight Apex. TBPs
calculated with congener- and homologue-specific BSAFs (Table 3). Pairs marked "n.s." are
not significantly different at P > 0.05 by bootstrap test of significance
The bootstrap uncertainty ratio for TBP (bootstrap confidence interval width TBP) was
approximately a factor of two (Table 6). The bootstrap confidence intervals included mean Ct for
the total HxCDF homologue group and for all congeners except 1,2,3,4,6,7,8-HpCDF and OCDF
(Figure 4, Table 6). Tissue concentrations of these two congeners and all the other homologue
groups were underestimated by bootstrap TBP.
When bootstrap simulations were performed using the overall mean BSAF, the resulting
confidence intervals were broader in most cases than when congener/homologue mean BSAFs
were used (Figure 5). Mean Ct fell below the lower bootstrap CL for 1,2,3,6,7,8-HxCDD,
1,2,3,7,8,9-HxCDD, 1,2,3,4,6,7,8-HpCDD, OCDD, OCDF, and total HxCDF, but was otherwise
within the bootstrap confidence interval. The bootstrap relative percent difference between TBP
and mean Ct was 40 percent to +200 percent when the bootstrap confidence interval included
mean Ct, and +130 percent to > +600 percent when mean Ct fell below the lower bootstrap CL.
14
|
|
Privacy Statement - Press Release - Copyright Information. - Contact Us - Support Integrated Publishing |