 |
||
|
|
||
|
Page Title:
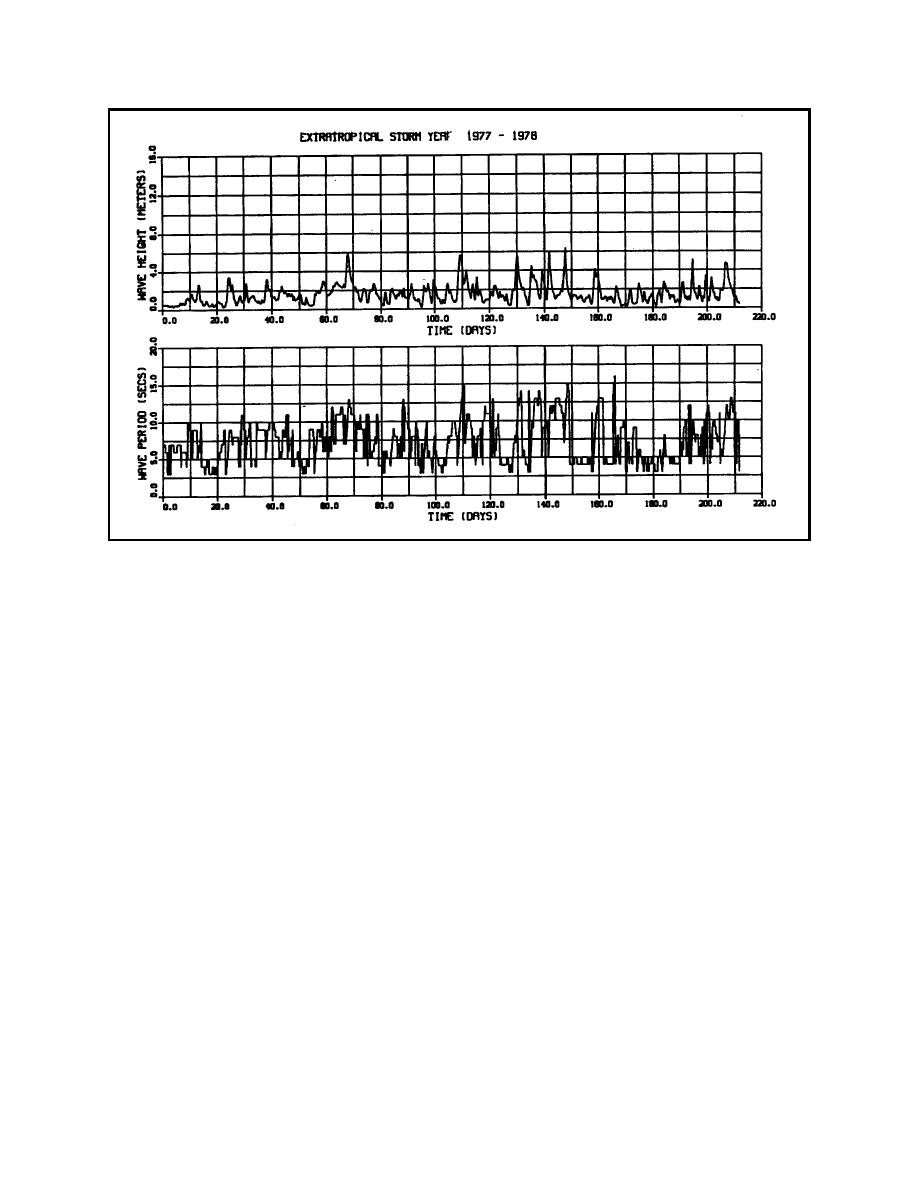
Figure G5. WIS wave height and period time series for 1977-78 extratropical storm season |
||
| |||||||||||||||
|
|
 Figure G5. WIS wave height and period time series for 1977-78 extratropical storm season
and mean grain size set at 0.40 mm. The 83 ft depth was the base depth area
within the Mud Dump site considered for capping; 0.40 mm sand was the
suggested cap material.
The sediment transport hydrograph for the 1977-78 storm season is shown in
Figure G6. As evident in the figure, distinct events are now clearly visible in the
time series. This approach to event identification is in contrast to the first order
parameter time series shown in Figure G5.
Analysis of the 16 seasonal transport hydrographs resulted in the adoption of
a threshold value of 30.0 10-4 ft3/sec/ft-width as the basis for selecting events
that may cause erosion to the Mud Dump site. This value, selected by trial and
error through application of the LTFATE model, will produce a maximum of
0.25 ft of vertical erosion per 24 hr at the corner of mound cap measuring 100 by
100 ft. Table G3 presents a summary of the analysis for the 1977-1993 storm
years in the form of the approximate day (measured from 1 September) of occur-
rence and the magnitude of the peak transport value. The total number of events
per season is also tabulated. According to this criteria, the computed average
number of events per year that impact the Mud Dump site is 38 events/16 sea-
sons = 2.375 events/year.
G17
Appendix G Procedures for Conducting Frequency-of-Erosion Studies
|
|
Privacy Statement - Press Release - Copyright Information. - Contact Us - Support Integrated Publishing |