 |
||
|
|
||
|
Page Title:
Figure G6. Sediment transport hydrograph for the 1977-78 storm season |
||
| |||||||||||||||
|
|
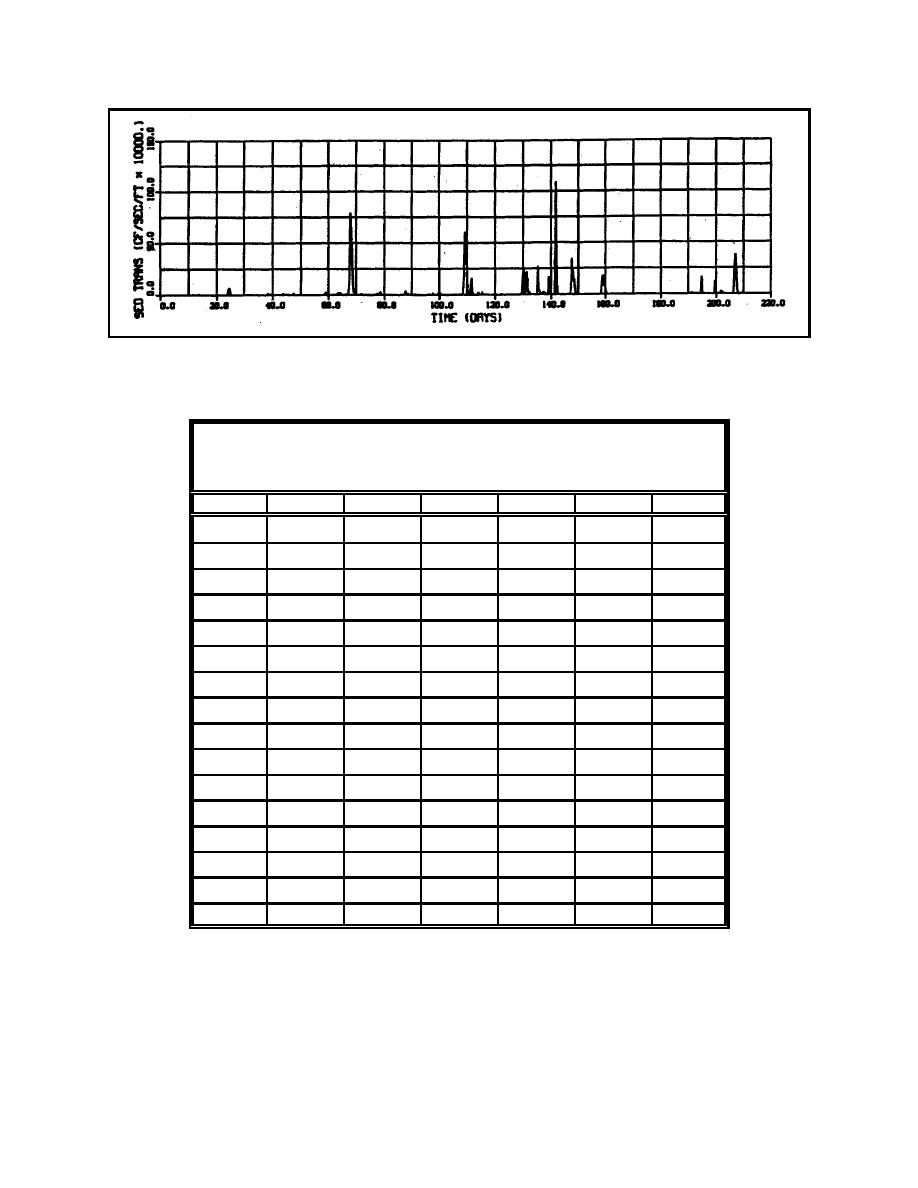 Figure G6. Sediment transport hydrograph for the 1977-78 storm season
Table G3
Summary of Storm Events by Day of Season/Maximum Transport
Year
1
2
3
4
5
Total
77-78
68/80
110/65
142/110
207/35
--
4
78-79
146/190
171/50
193/50
205/50
--
4
79-80
132/35
138/35
195/50
--
--
3
80-81
55/125
154/70
163/105
210/30
--
4
81-82
--
--
--
--
--
0
82-83
55/70
164/50
199/50
--
--
3
83-84
41/35
102/110
180/45
210/165
--
4
84-85
43/85
165/180
--
--
--
2
85-86
27/160
65/125
160/30
191/30
200/70
5
86-87
93/190
115/40
123/40
--
--
3
87-88
--
--
--
--
--
0
88-89
--
--
--
--
--
0
89-90
49/33
--
--
--
--
1
90-91
--
--
--
--
--
0
91-92
126/40
--
--
--
--
1
92-93
101/150
165/30
185/120
194/155
--
4
The purpose of selecting specific storms is ultimately to determine frequency-
of-occurrence relationships. The specific effect of interest will clearly have a
direct bearing on the selection of appropriate storm events. For example, the
10 storm events that cause the most shoreline erosion at a particular location are
not necessarily the same 10 events that cause the most vertical erosion of a
G18
Appendix G Procedures for Conducting Frequency-of-Erosion Studies
|
|
Privacy Statement - Press Release - Copyright Information. - Contact Us - Support Integrated Publishing |
