 |
||
|
|
||
| |||||||||||||||
|
|
 capped mound in the same area. A separate storm analysis would be required to
identify events that cause shoreline/dune recession. However, this second-order
parameter approach to storm isolation has been found to be successful in identi-
fying events that cause erosion to a disposal mound. By defining the appropriate
parameter, the approach is equally applicable to shoreline processes analyses.
Because vertical erosion is the impact of interest, the transport hydrographs
(Figure G6 for 1977-78) were used to identify 38 specific events with a peak
ft-width at the Mud Dump site. These events are listed in Table G3. For each
event, surge, tidal, and wave field time series were extracted from the seasonal
summary tables to generate hydrographs of total water surface elevation (storm
plus tide), total U and V current (storm plus tide), and wave height and period.
Each of the 152 hydrographs (38 events with 4 tidal phases) was constructed to
be 6 days in duration, centered on the day indicated in Table G3. These hydro-
graphs represent input to the LTFATE model.
LTFATE Model Simulations
After the selected storms have been identified, LTFATE simulations should
be used to determine the maximum amount of vertical erosion resulting from
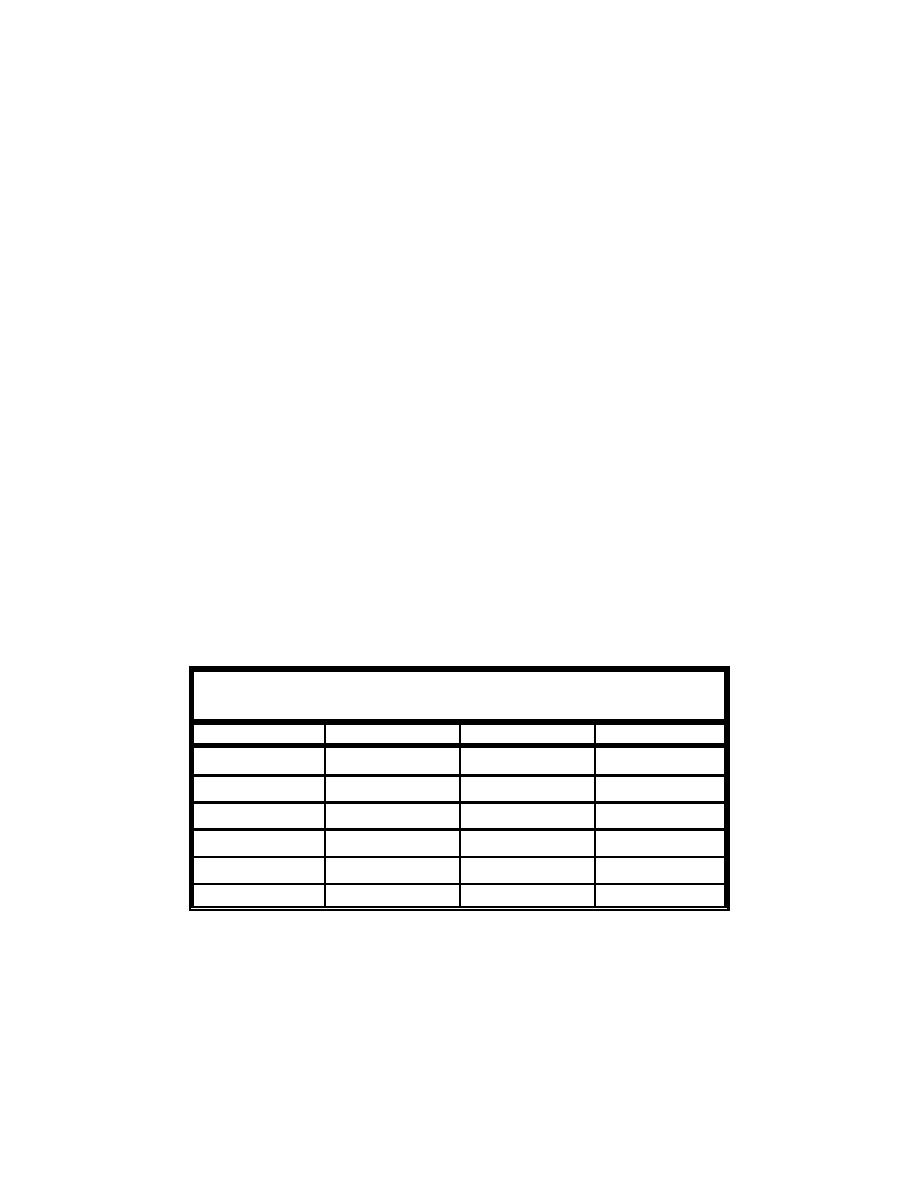
each storm for each of the disposal site configurations of interest. As noted
earlier, for the Mud Dump site, six combinations of ambient depth, mound
height, and crest depth were tested (Table G4). All mound configurations had
side slopes of 1:50 with the cap material specified to be noncohesive sand with a
d50 of 0.40 mm.
Table G4
Mud Dump Mound Configurations
Test Number
Ambient Depth, ft
Mound Height, ft
Crest Depth, ft
1
63
13
50
2
63
8
55
3
73
13
60
4
73
8
65
5
83
13
70
6
83
8
75
LTFATE input file generation
The surge, tidal, and wave field time series must be placed into a format com-
patible with LTFATE. An example LTFATE input file for hurricane #835 is
shown in Table G5. For the Mud Dump study, storm-event input files
G19
Appendix G Procedures for Conducting Frequency-of-Erosion Studies
|
|
Privacy Statement - Press Release - Copyright Information. - Contact Us - Support Integrated Publishing |
