 |
||
|
|
||
|
Page Title:
Table L-3. Number of Survivors in a Hypothetical Water Column Toxicity Test after 96 hr |
||
| |||||||||||||||
|
|
 separate control was necessary. In other cases, the dilution water may be
receiving water and a separate laboratory control would be required. Analysis of
this example data will be conducted using the decision tree in Figure L-1.
Numbers in parentheses in the text refer to numbered nodes of the decision tree.
The SAS program WATTOX and complete results for water column toxicity test
data analyses are provided in Section L.4.1; some additional analyses were
conducted using SYSTAT programs.
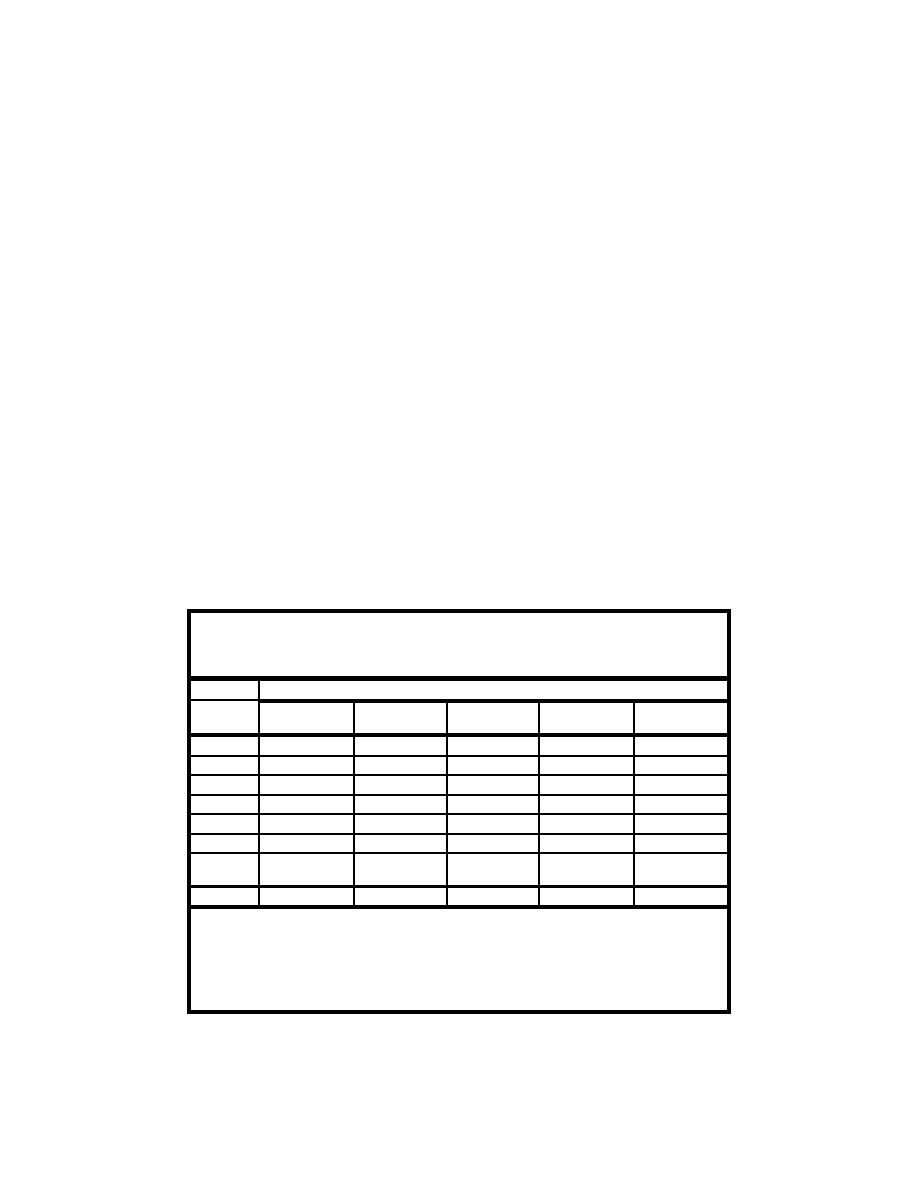
Means (1) and SE for the survival data are provided in Table L-3. Overall
mean survival in the control (= dilution) water was 98 percent, indicating that the
test was acceptable (2). The statistical comparison of 100 percent elutriate sur-
vival and dilution water survival was then conducted because the 100 percent
elutriate survival was at least 10 percent lower than the dilution water survival
(3). The next step was to arcsine transform the survival proportions for the
dilution water and 100 percent elutriate treatments (4).
Tests of Assumptions. Following arcsine transformation, the data were tested
for normality (5) to determine whether parametric or nonparametric procedures
should be used. Table L-4 provides the results of tests for normality and equality
of variances for the example data. The value of Shapiro-Wilk's W for the
arcsine-transformed data was 0.846, with associated probability (P) = 0.051.
Because this value of P exceeds 0.05 (a level from Table L-2, N = 10, balanced
design), we conclude that the data do not depart significantly from the normal
distribution (5), and we now examine the results of the tests for equality of
variances (6).
Table L-3
Number of Survivors in a Hypothetical Water Column Toxicity Test
after 96 hr
Treatment1
Dilution
2
Water3
Replicate
100 percent
50 percent
25 percent
12.5 percent
1
20
6
8
12
17
2
19
7
8
18
17
3
20
9
9
15
18
4
20
5
10
14
16
5
19
8
11
13
18
Total
98
35
46
72
86
19.6
7.0
9.2
14.4
17.2
Mean
(98 percent)
(35 percent)
(46 percent)
(72 percent)
(86 percent)
SE
0.24
0.71
0.58
1.03
0.37
1
Percent concentrations of dredged-material elutriate:
100 percent = 1 part elutriate plus 0 part dilution water
50 percent = 1 part elutriate plus 1 part dilution water
25 percent = 1 part elutriate plus 3 parts dilution water
12.5 percent = 1 part elutriate plus 7 parts dilution water.
2
20 organisms per replicate at initiation of test.
3
In this example, the dilution water was control (laboratory) water.
L16
Appendix L
Statistical Methods
|
|
Privacy Statement - Press Release - Copyright Information. - Contact Us - Support Integrated Publishing |
