 |
||
|
|
||
|
Page Title:
L.2.1.2.2 Analysis of example data |
||
| |||||||||||||||
|
|
 Logistic methods. In this manual, we recommend the use of untransformed
mortality for simplicity and consistency. However, LC50 estimates using other
scales can easily be calculated for comparison.
L.2.1.2.2 Analysis of example data
The data from Table L-3 were analyzed using several different LC50
methods, including the Probit procedure in the SAS program WATTOX
(Section L.4.1.1). In the Probit output (Section L.4.1.2), the chi-square
goodness-of-fit statistic (shown in bold) is not significant (?2 = 1.7558, P =
0.4157), indicating acceptable fit to the Probit model (i.e., no significant lack of
fit). The LC50 is obtained from the second output table of probabilities, where
probability = 0.50 (shown in bold). Other lethal effects concentrations may be
obtained from the same table, e.g., LC10 or LC5. The SAS Probit plot of
observed and predicted mortalities is given in Figure L-3.
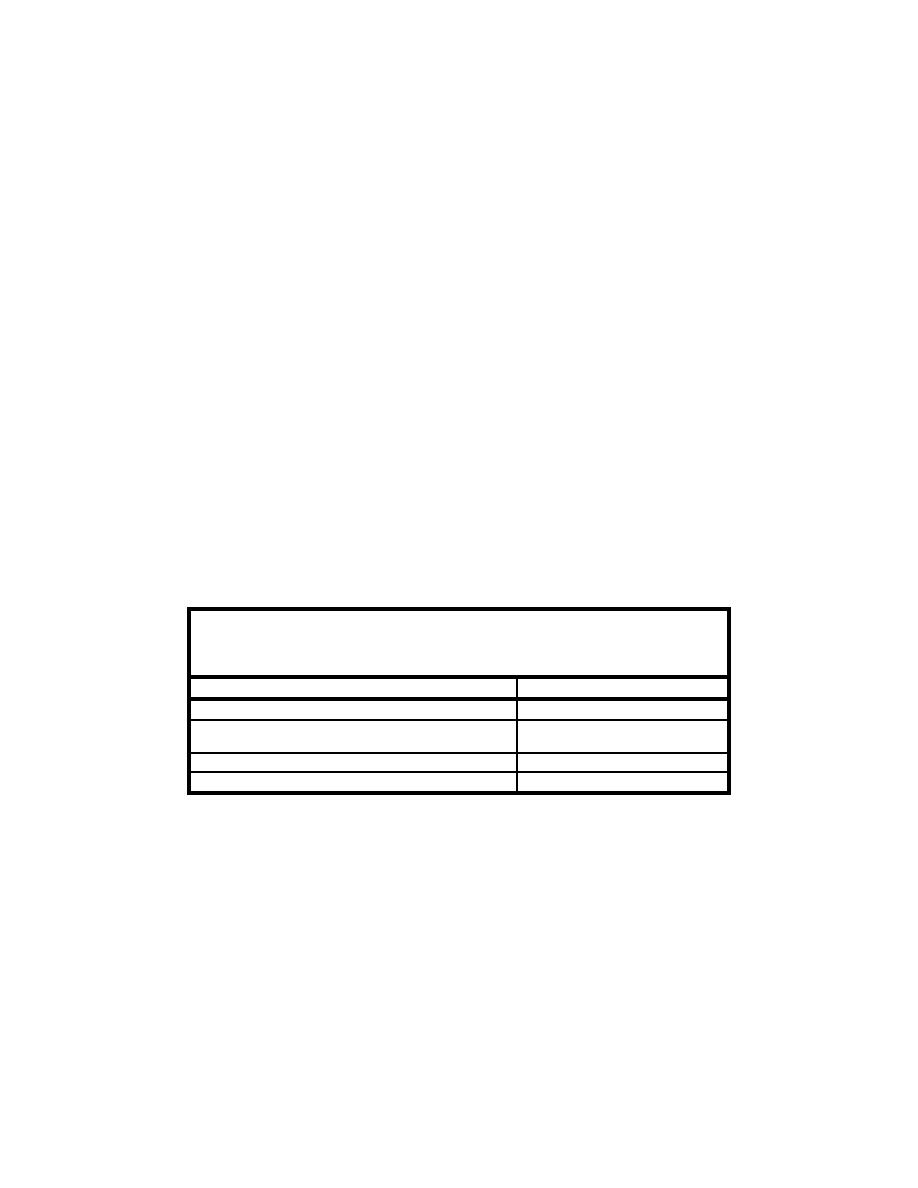
Table L-5 provides LC50 estimates calculated by several different methods
using the example data in Table L-3. The data from the five replicates for each
concentration may be pooled and entered as the number responding (dying) out
of 100. Because pooling over replicates ignores any additional variance in
survival among replicates (i.e., beyond the expected error from sampling the
binomial distribution), the confidence limits provided by the programs may not
be accurate and should not be reported or used. Because the LC50 is required
only for use in the mixing model (Appendix H), confidence limits are not
needed.
Table L-5
Calculated LC50 Values for Example Water Column Toxicity Test
Data
Method
LC50 Estimate (percent v/v)
Probit
52.6
Linear Interpolation - untransformed mortality -
44.9
arcsine-transformed mortality
45.1
Trimmed Spearman-Karber
48.4
Logistic
52.6
The Probit LC50 was calculated with the EPA PROBIT program and was
almost identical to the Logistic LC50 calculated using the SYSTAT LOGISTIC
program (the same estimates are obtained using the SAS PROBIT procedure).
almost identical to the LC50 calculated using arcsine-transformed mortality. The
TSK LC50 was calculated using a program modified from an original program
described in Hamilton, Russo, and Thurston (1977), and was intermediate
between the Linear Interpolation and regression (Probit and Logistic) estimates.
L24
Appendix L
Statistical Methods
|
|
Privacy Statement - Press Release - Copyright Information. - Contact Us - Support Integrated Publishing |
