 |
||
|
|
||
| |||||||||||||||
|
|
 sample size for the reference, and decreasing sample size for the test sites. The
optimal apportionment of replicates is to make the sample size for the reference
/k times the sample size for the test sites (Dunnett 1955). Increasing sample
size for the reference is effective because the reference is involved in every
comparison, whereas the test sites are involved in only one comparison each.
L.3.2 Analysis of example data
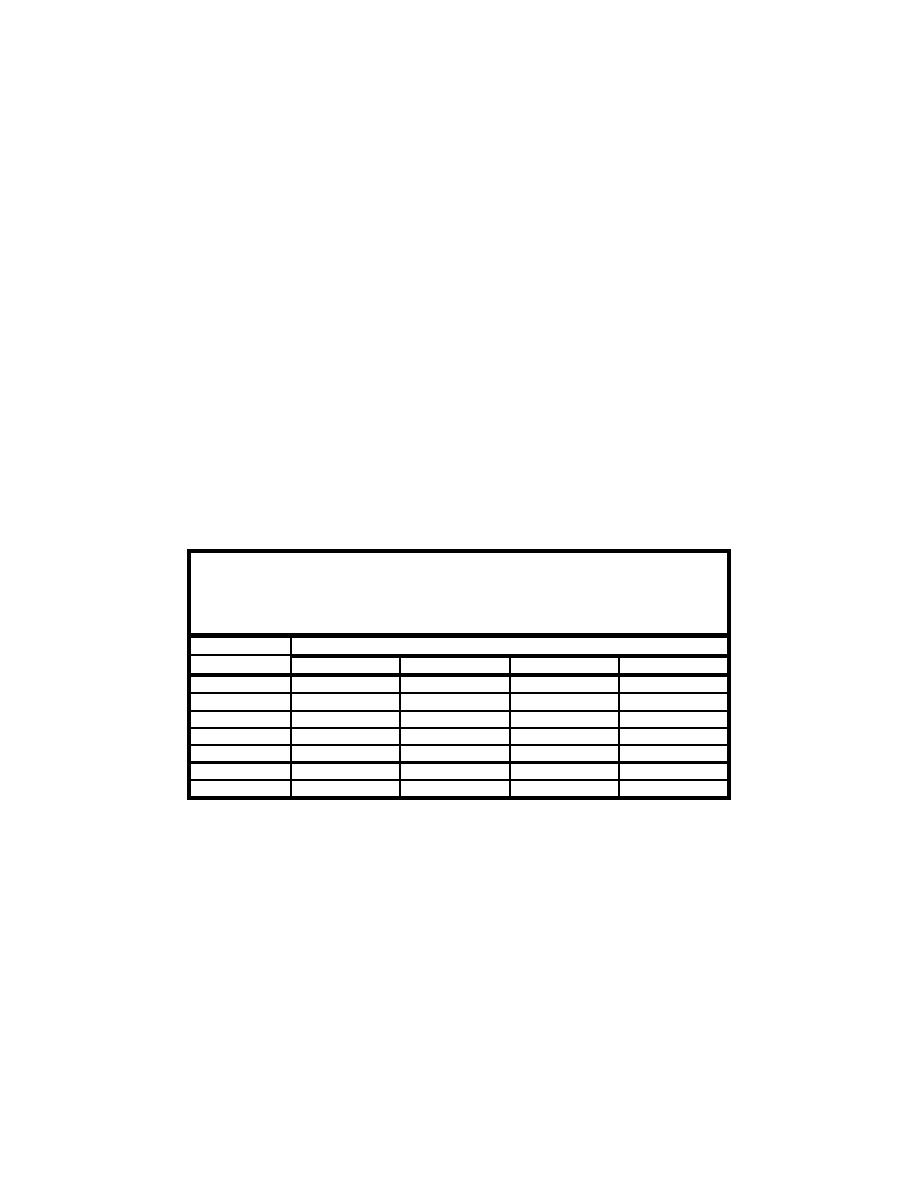
Table L-6 presents example results for one contaminant from a hypothetical
laboratory bioaccumulation test, in which animals were exposed to a reference
sediment and to three different dredged sediments. Chemical analysis of the
tissue samples from each replicate shows that concentrations of the example
contaminant varied among and within treatments. Two types of analyses may be
performed on the tissue contaminant concentration data:
Comparisons between each dredged sediment treatment and the
reference.
Comparisons with an action level when applicable.
Computer procedures for statistical analysis of bioaccumulation data are
given in SAS program BIOACC (Section L.4.2).
Table L-6
Results from a Hypothetical Bioaccumulation Test, Showing
Contaminant Concentrations (g/g) in Tissues of Animals
Exposed to Different Treatments
Treatment
Replicate
Reference
Sediment 1
Sediment 2
Sediment 3
1
0.06
0.16
0.24
0.13
2
0.05
0.19
0.10
0.05
3
0.05
0.18
0.13
0.17
4
0.08
0.22
0.18
0.08
5
0.09
0.31
0.30
0.22
Mean
0.066
0.212
0.190
0.130
SE
0.008
0.026
0.036
0.030
L.3.2.1 Comparisons with a reference sediment
Analysis of the example data follows the decision tree steps in Figures L-4a
and 4b, with numbers in parentheses in the text referring to numbered nodes of
the decision trees. The objective of this type of analysis is to determine whether
organisms exposed to the dredged material accumulate greater tissue
contaminant levels than organisms exposed to the reference. One-sided tests are
appropriate because there is little concern if bioaccumulation from dredged
material is less than bioaccumulation from the reference. If mean tissue
concentrations of contaminants of concern in organisms exposed to dredged
material are less than or equal to those of organisms exposed to the reference (1),
no statistical analysis is required.
L30
Appendix L
Statistical Methods
|
|
Privacy Statement - Press Release - Copyright Information. - Contact Us - Support Integrated Publishing |
