 |
||
|
|
||
|
Page Title:
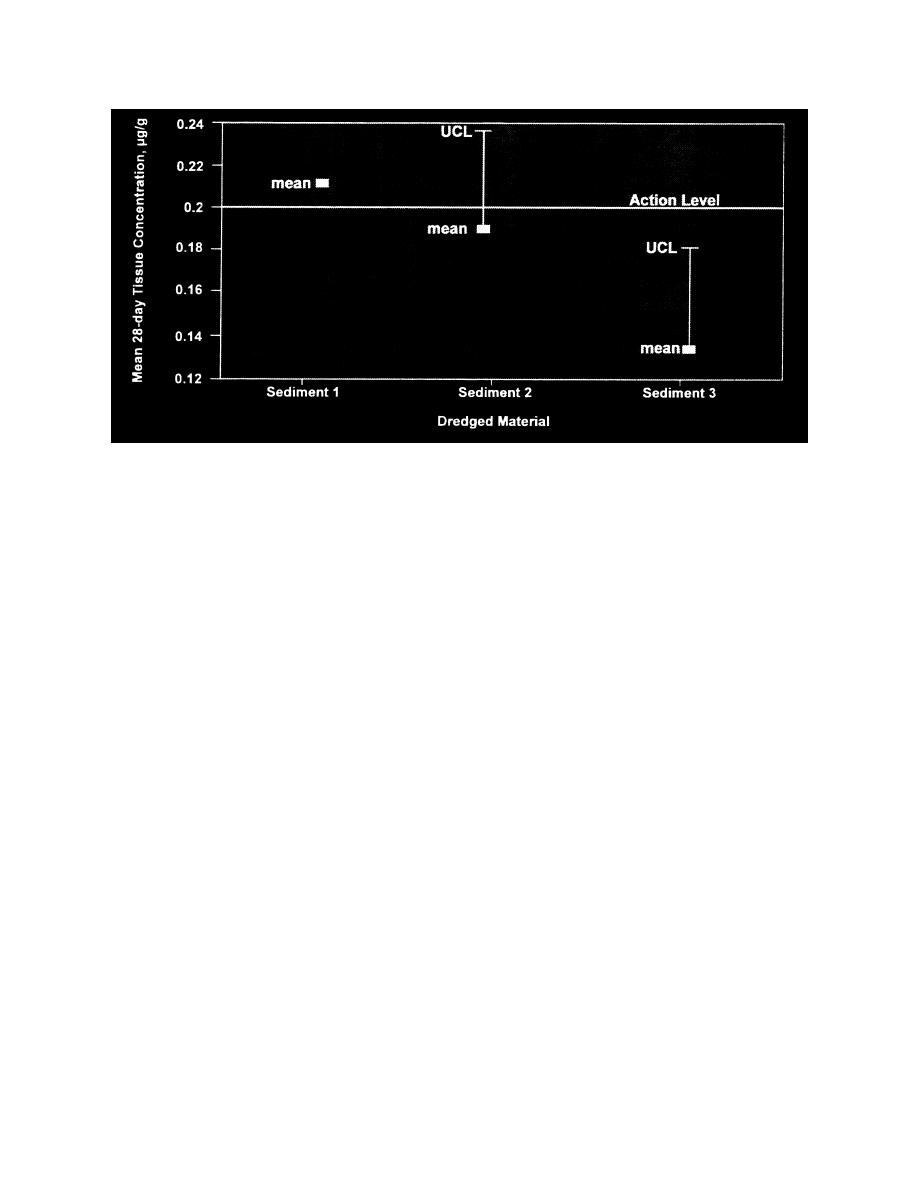
Figure L-5. Comparison of mean dredged material contaminant tissue levels and 95 percent upper confidence level (UCL) with hy... |
||
| |||||||||||||||
|
|
 Figure L-5. Comparison of mean dredged material contaminant tissue levels and 95 percent upper
confidence level (UCL) with hypothetical action level
Formulae for calculating statistical power for comparisons to a fixed
standard such as an action level are very similar to Equations L-8 and L-9:
n = ( t 1-α ,v + t 1-β ,v )2 ( s 2/ d 2 )
(L-28)
where s2 and v (degrees of freedom) are MSE and N - k if variances are equal (or
expected to be equal, if the calculation is made prior to testing), and s2 for the
individual sediment and ni - 1 if variances are unequal. It is usually easier to use
the z-approximation (from Alldredge 1987) to avoid solving for n iteratively:
n = ( z 1-α + z 1-β )2 ( s 2/ d 2 ) + 0.5( z 1-α )
2
(L-29)
The formulae indicate that the sample size required to detect any given
difference d will be approximately one-half that required for a comparison of
two treatments. The sample size required is lower because the comparison is
made to a fixed value, rather than to a reference which can also vary. Thus, at
least in theory, there is no sampling uncertainty or error for the fixed standard
and we know the true value of one of the two things being compared.
Using the z-approximation and s2 = MSE, the sample size required to provide
a 0.95 probability (1 - = 0.95) of detecting a tissue level 25 percent (0.05 g/g)
below the action level is:
n = (1.645 + 1.645)2(0.003763)/0.0025 + 0.5(1.645)2 = 18
(L-30)
The minimum significant difference is:
dmin = t0.95,16(MSE/n)2 = 1.746(0.003763/5)2 = 0.048 g/g
(L-31)
L38
Appendix L Selected Resource Documents
|
|
Privacy Statement - Press Release - Copyright Information. - Contact Us - Support Integrated Publishing |